Population Characteristics
 |
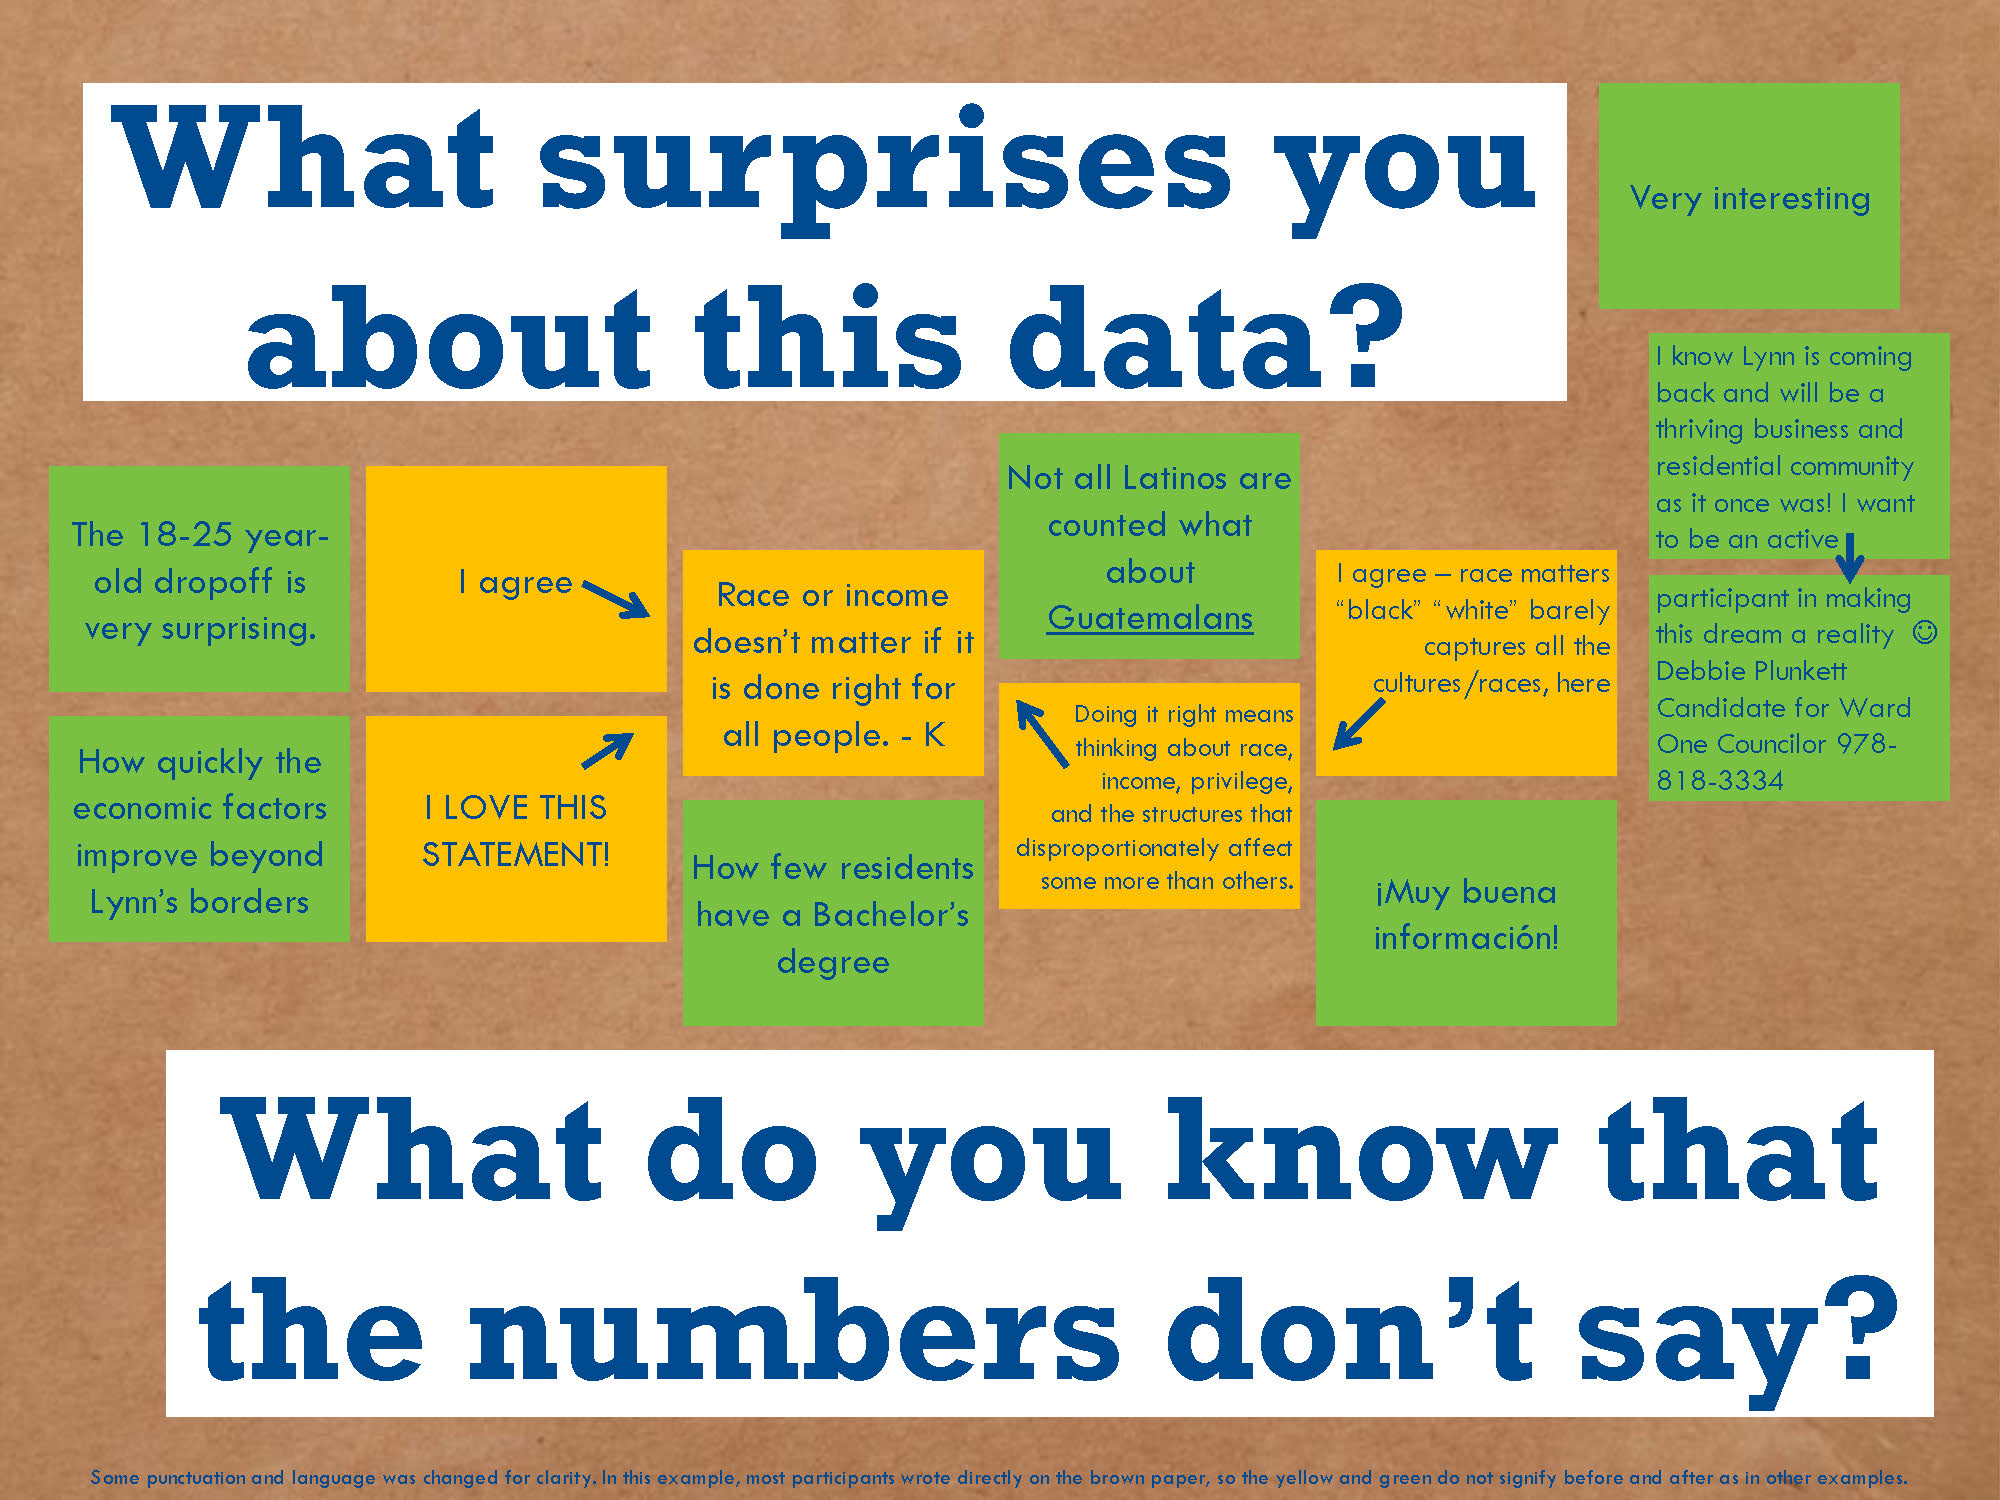
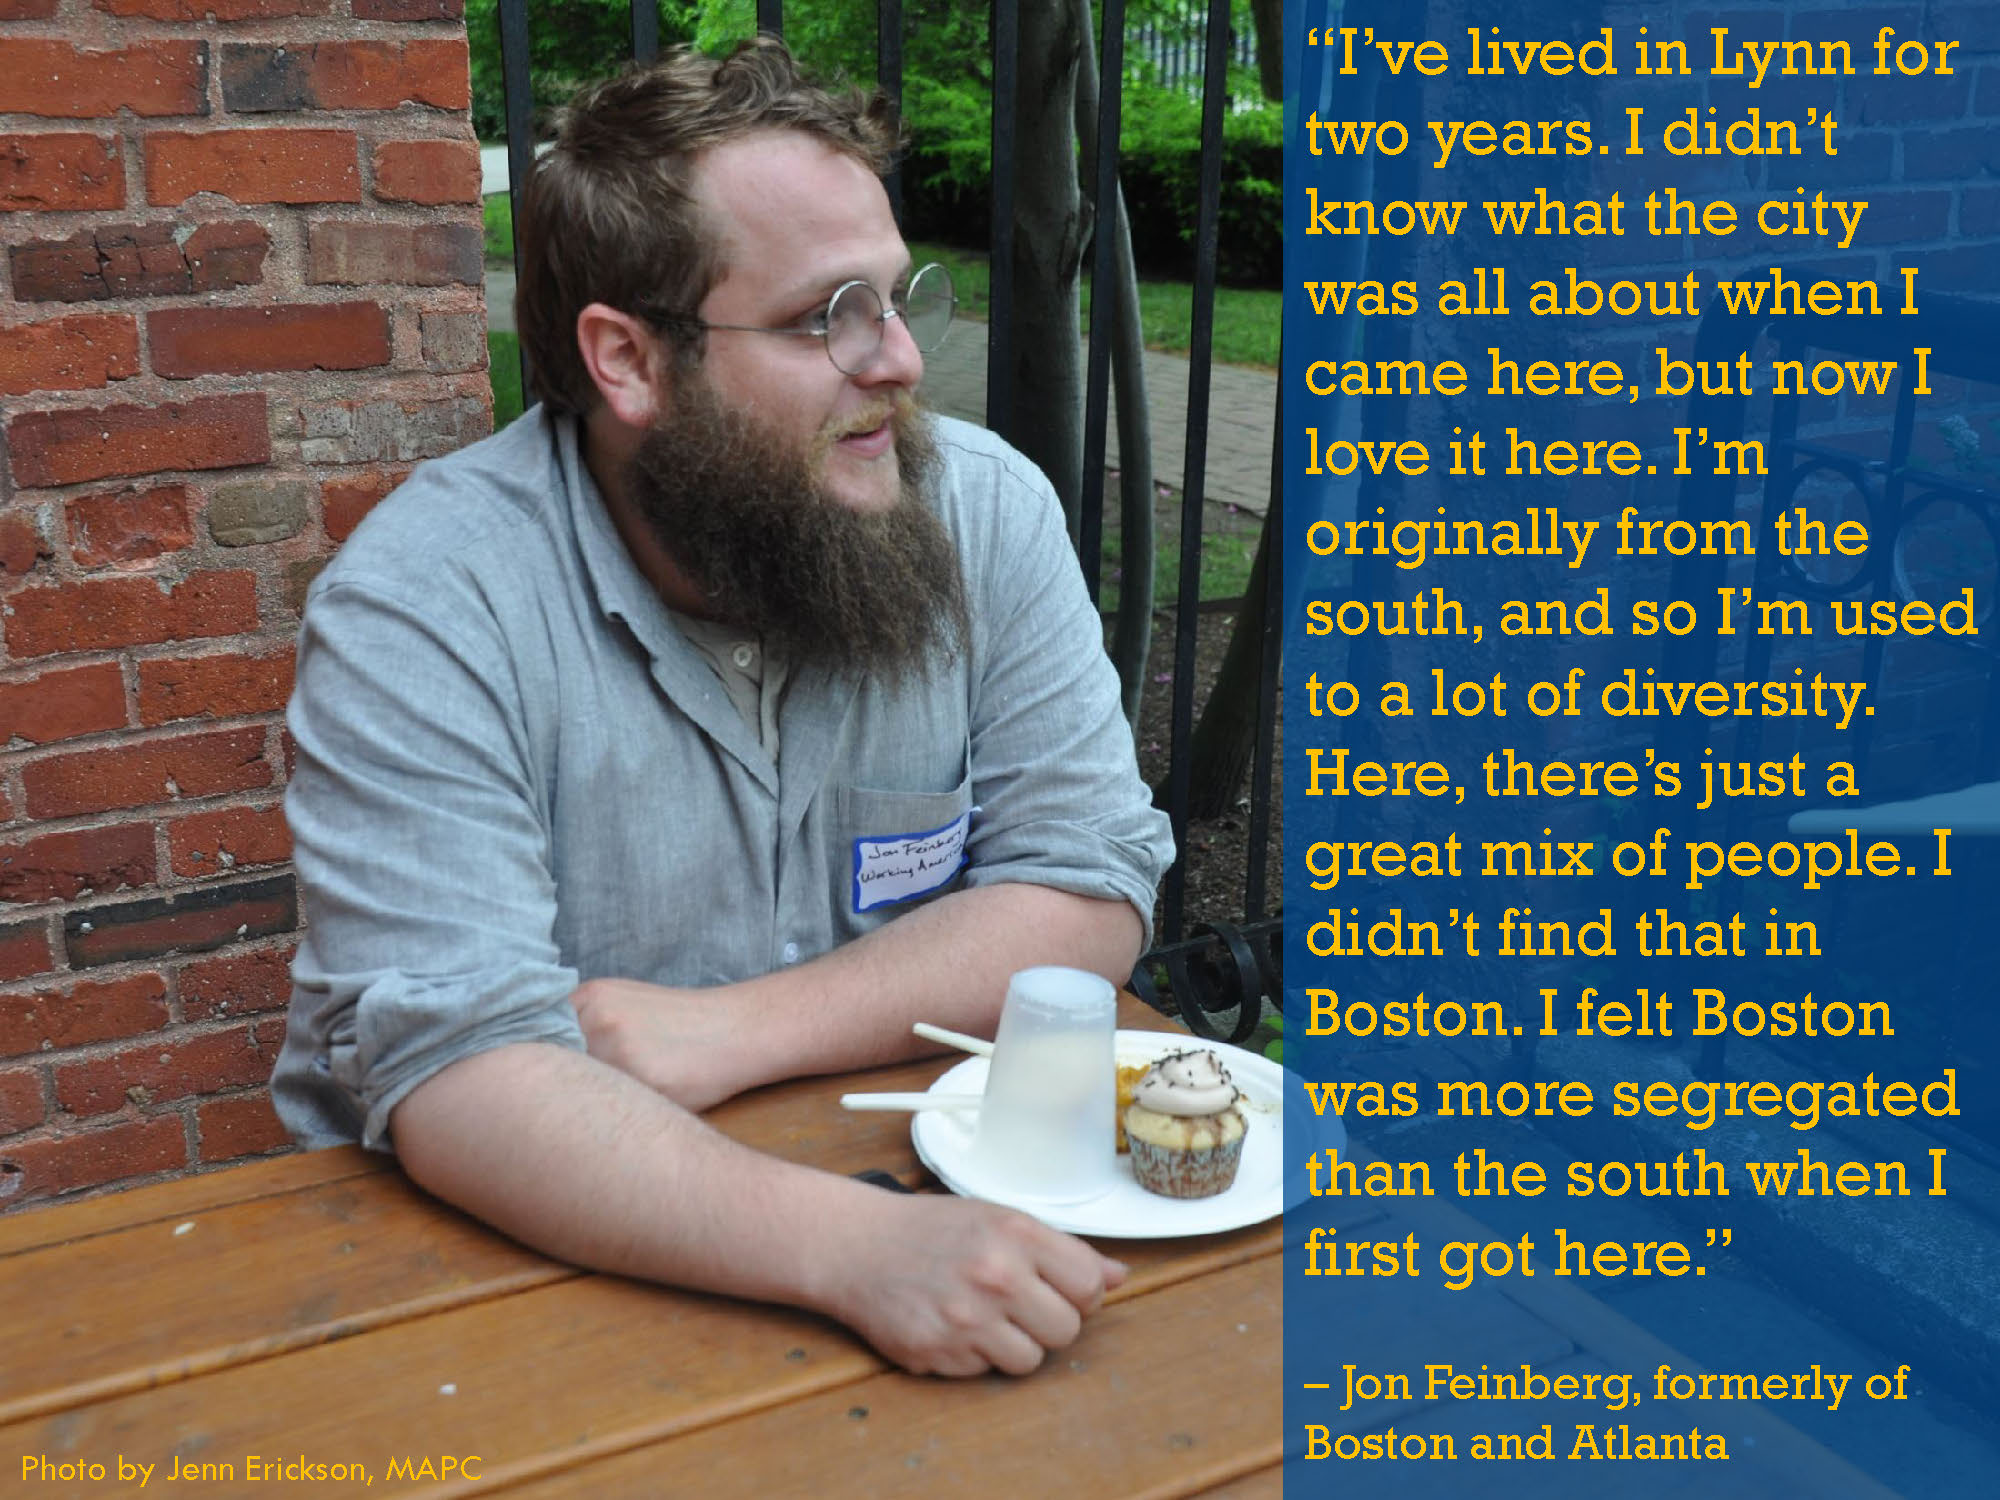
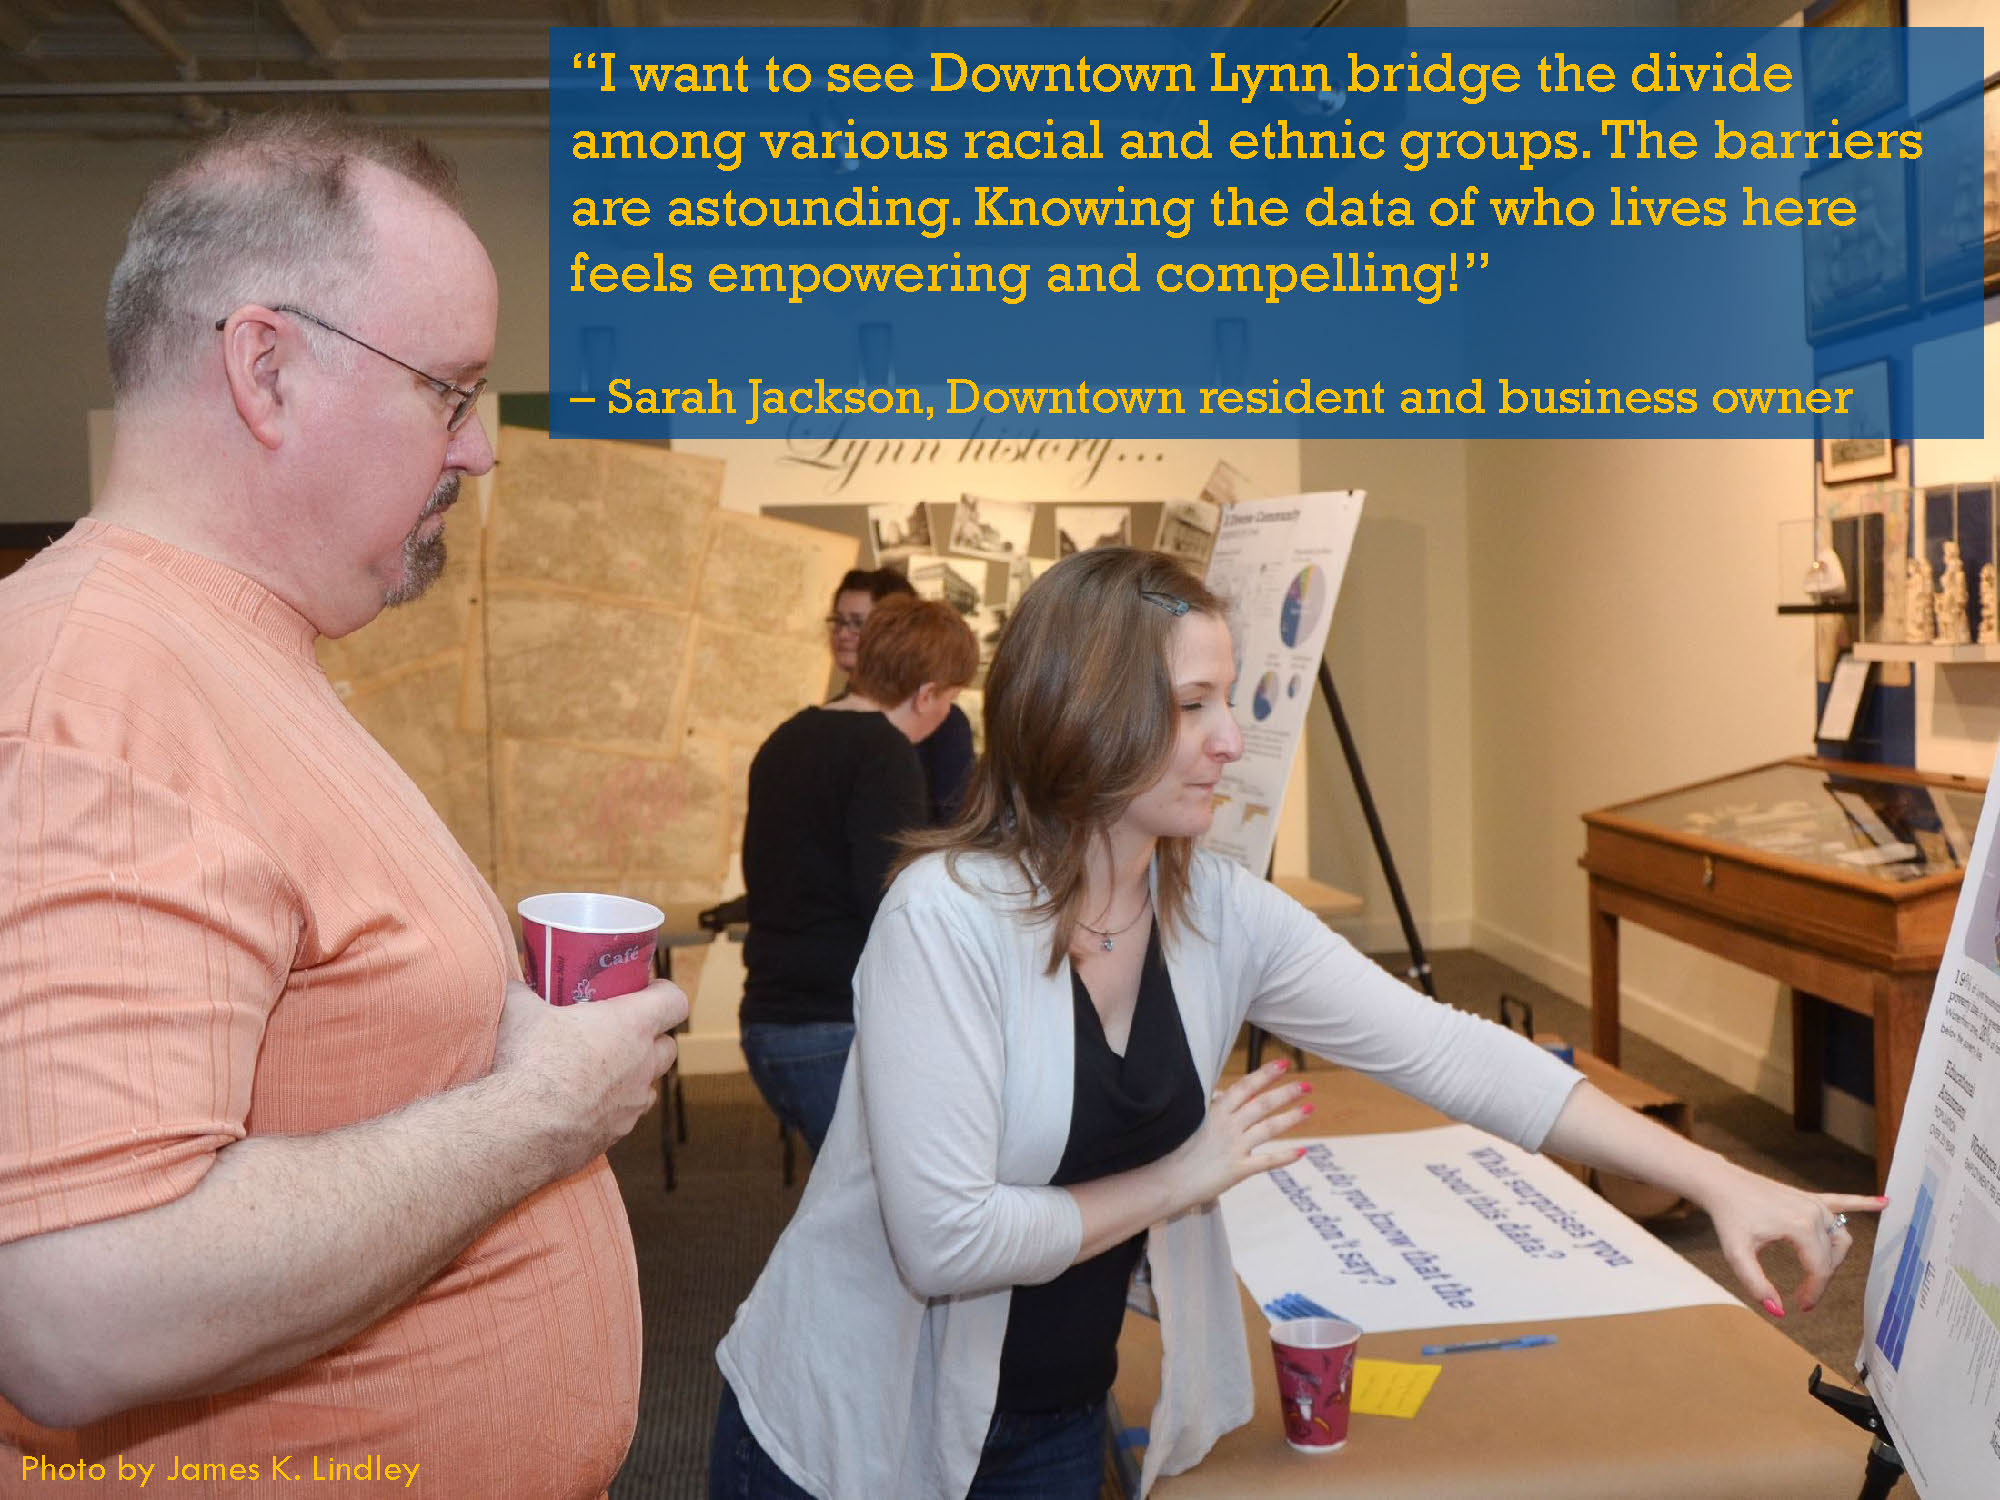
Images above and below from the May 2013 Public Forum, featuring comments from forum participants. Photos by James K. Lindley and Jennifer Erickson. |
 |
|
 |
|
Love population data and maps? For more population characteristics about Lynn, visit the Lynn Community Snapshot on the MetroBoston DataCommon, which includes maps, charts, and tables with more data on Lynn's demographics, civic vitality and governance, economy, education, environment and energy, housing, public health, and transportation. MetroBoston DataCommon is a partnership between MAPC and the Boston Indicators Project at the Boston Foundation. Learn how to create your own data visualizations at monthly trainings held at MAPC or a location near you upon request, depending on staff availability. |
The population of Lynn at the time of the 2010 US Census was 90,329 residents, and more recent population estimates from the American Community Survey indicate that the population has increased by about 1% or roughly 900 residents since then. For this project, we defined two smaller areas for analysis using Census data: the Downtown study area, and a larger area that includes the Census Tracts in Downtown as well as the Waterfront. The 2010 population of the smaller Downtown study area was 3,929 residents, and the population of the "greater study area" was 25,809 residents.
Youth under the age of 18 make up 25% of Lynn's population, including children under age 5 which make up over 7% of the city's population, Seniors age 65 and older make up 11% of the population. In comparison, youth under 18 make up 22% of the Massachusetts population, children under 5 make up less than 6%, and seniors 65+ make up 14%.
There are about 33,655 households in Lynn and the average household size is 2.66, slightly larger than the average household size for Massachusetts, which is 2.5 (Lynn, Massachusetts QuickFacts from the US Census Bureau).
Lynn is racially and ethnically diverse, and residents of Lynn come from all over the world and speak many languages. Residents of color make up 52% of Lynn's total population. In the Downtown Study Area, residents of color make up 57% of the population, and in the Census Tracts that make up the greater Downtown and Waterfront study area, the population is 66% residents of color.
Residents of color in Lynn as a whole include those who identified their race on the 2010 Census as Black or African American alone (12.8%), American Indian or Alaska Native alone (0.7%), Asian alone (7.0%), Native Hawaiian and Other Pacific Islander alone (0.1%), or Two or More Races (5.0%). It also includes those who identified their ethnicity as Hispanic or Latino (32.1%). Residents who identified as white alone and not Hispanic or Latino make up 48% of the population.
Over 40% of Lynn's population was born outside Massachusetts, according to American Community Survey 5-year estimates for 2007-2011. About 9% of Lynn residents were born in the United States, but in a different state. Close to one-third of Lynn's residents were born outside the United States and hail from many regions of the world, particularly Central America, the Caribbean, Asia, and Europe. The top places of origin for Lynn residents born outside the United States include the Dominican Republic (6.4%), Guatemala (4.5%), Puerto Rico, U.S. island areas, or born abroad to American parents (3.0%), Cambodia (2.6%), El Salvador (2.3%), Haiti (1.2%), Russia (0.9%), Honduras (0.8%), Greece (0.8%), Vietnam (0.7%), Nigeria (0.7%), Mexico (0.6%), and Brazil (0.6%).
About 42% of Lynn residents to speak a language other than English at home. Close to one-third of Lynn households do not speak English very well, and may struggle to interpret information distributed only in English. Of these households, 64% speak Spanish as their primary language.
Lynn faces more severe economic challenges than Massachusetts as a whole. The median household income in Lynn, $44,367, is the second-lowest among cities and towns in the Inner Core Subregion and is two-thirds that of the statewide median of $65,981. Across the Commonwealth, 10.7% of households have incomes below the poverty level, and in Lynn this percentage jumps to 19.2%, or nearly one of every five households. For households in the greater Downtown and Waterfront study area, the situation is even more stark: 28% of households live below the poverty line.
Among residents age 25 and over, 21% do not have a high school degree. In Massachusetts as a whole, 39% of residents age 25 and over have a Bachelor's degree or higher and in Lynn, 17% have a Bachelor's degree or higher. In the greater Downtown and Waterfront area, 28% of residents have less than a high school degree.
Other indicators of economic health, such as homeownership and retail sales, are also lower in Lynn. The homeownership rate in Lynn is 48%, while statewide, the homeownership rate is 64%. Retail sales per capita, measured in 2007, are 53% of what they are statewide: $7,175 in Lynn compared to $13,553 in Massachusetts.
It is our view that Lynn's incredible diversity, affordable residential and commercial real estate, and stimulating urban environment are the key the City's future success. As Downtown Lynn pursues this vision for a thriving, vibrant, and economically competitive future, community members should not lose sight of the needs of all its members: Downtown Lynn can be a model for equitable revitalization as it becomes more prosperous while also continuing to serve those in need.